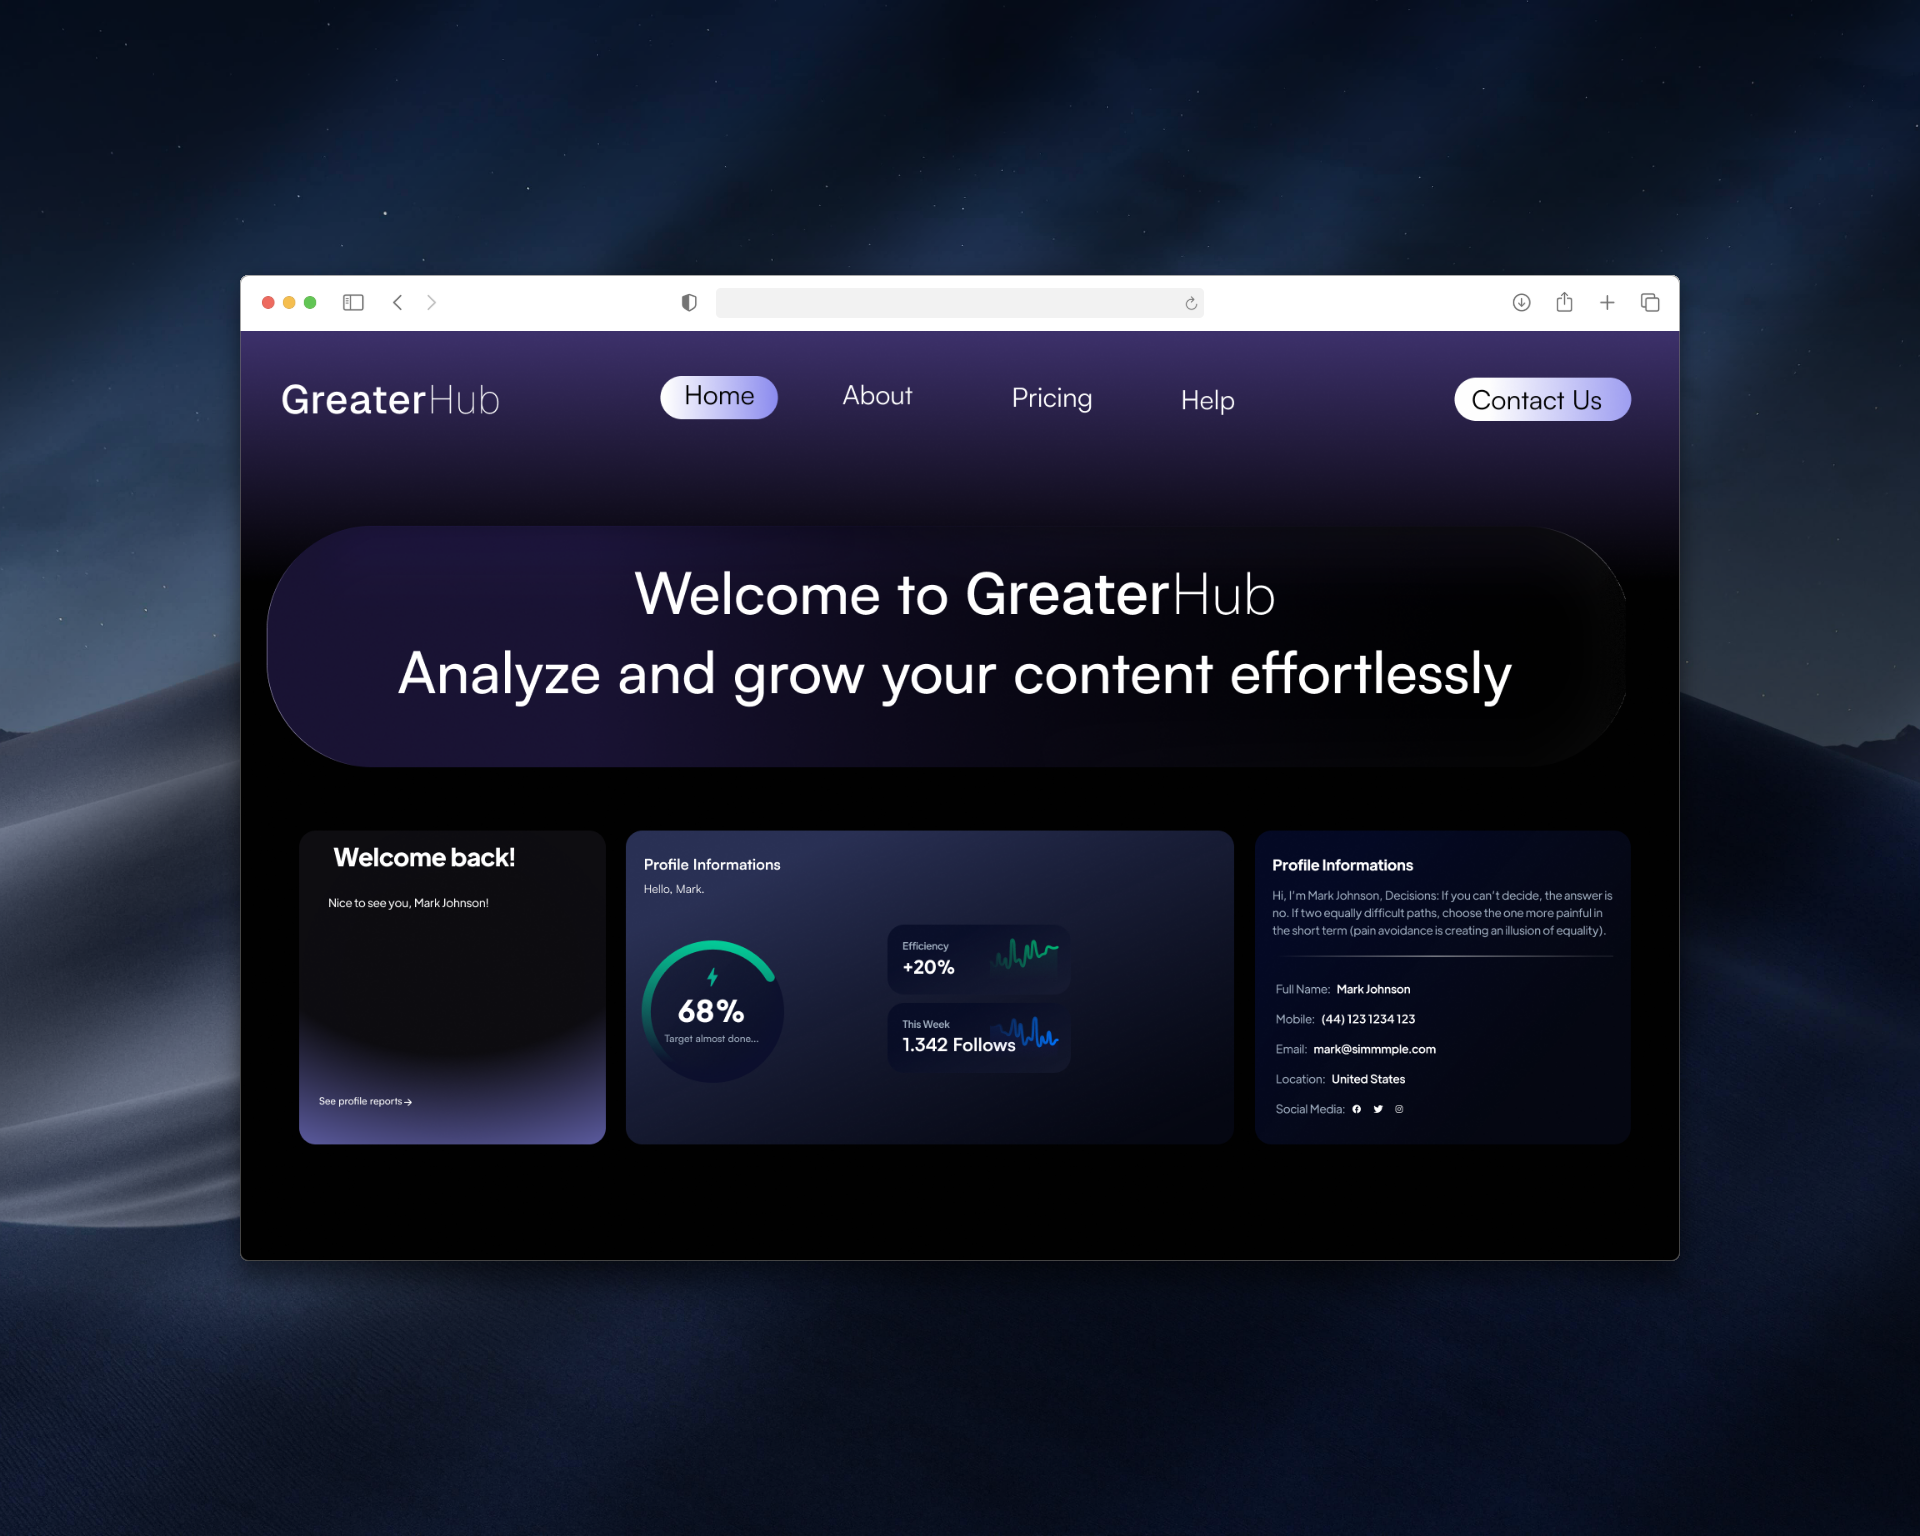
SaaS Platform for Social Media Analytics
A clean analytics workspace that helps creators decode their social performance at a glance.
[ N° 02 // Visuals ]
Inside the work.
Drag, swipe or use the arrows to scrub through the project's key frames.
01 / 00
[ N° 03 // The Story ]
From brief
to outcome.
Overview
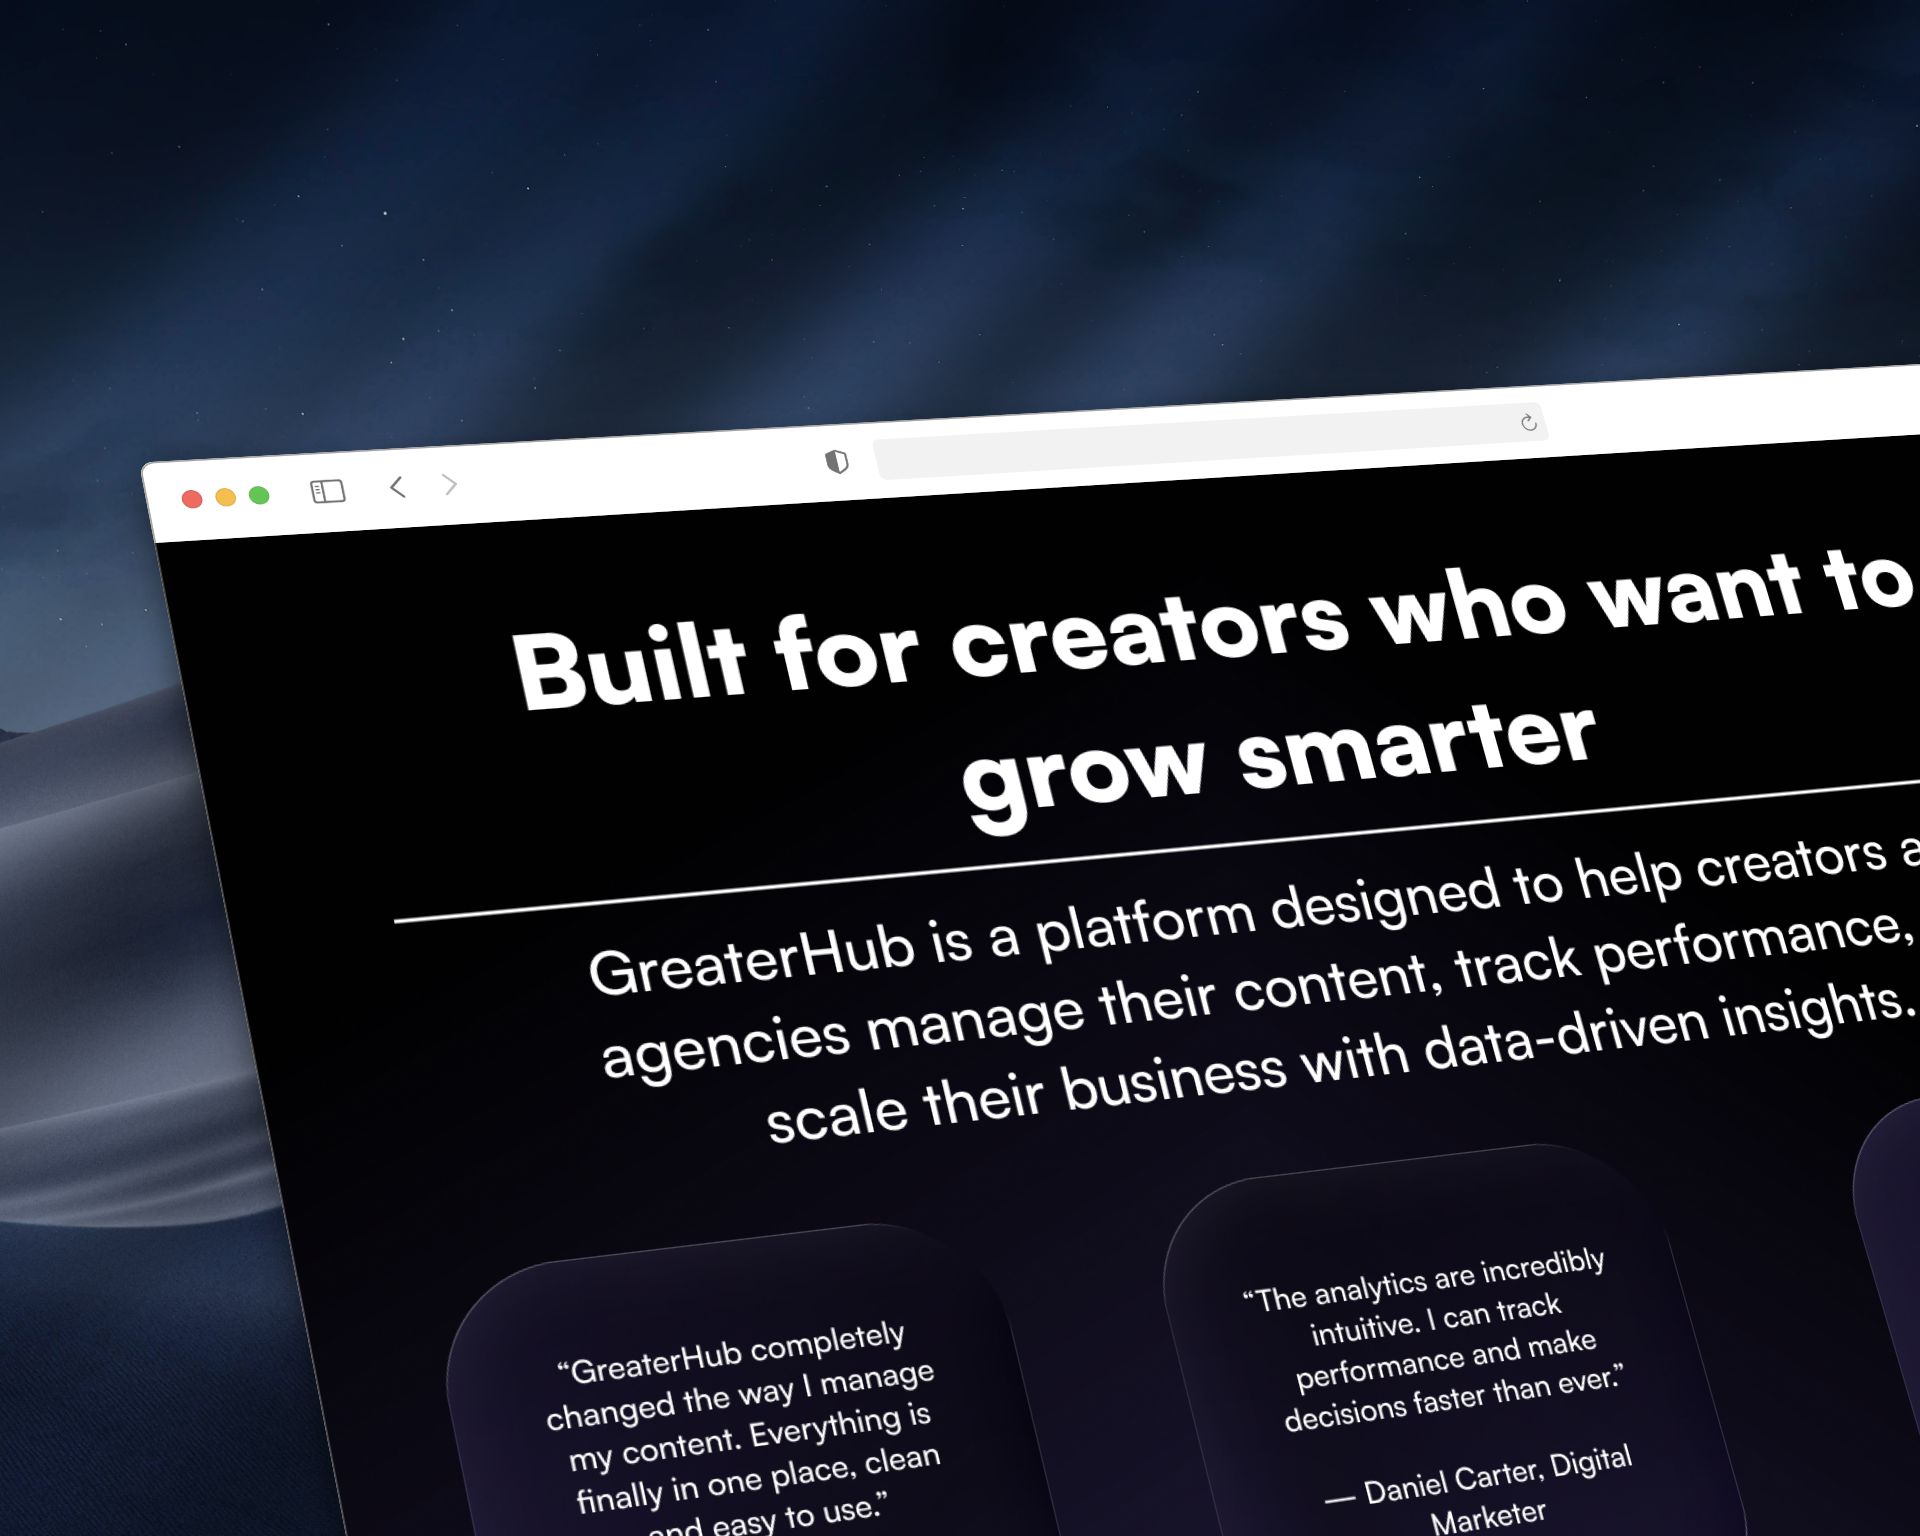
A full product surface for a social analytics SaaS — dashboards, reports, comparisons, and an onboarding flow built on a tight design system of components and tokens.
Problem
Creators were drowning in raw metrics across 4–5 platforms with no unified narrative. The first prototypes felt like spreadsheets — accurate but unreadable — and onboarding dropped users before they ever reached the dashboard.
Challenge
Translate dense numeric data into a calm, scannable interface where signal beats noise. The hardest part was balancing density with breathing room across desktop and tablet.
Outcome
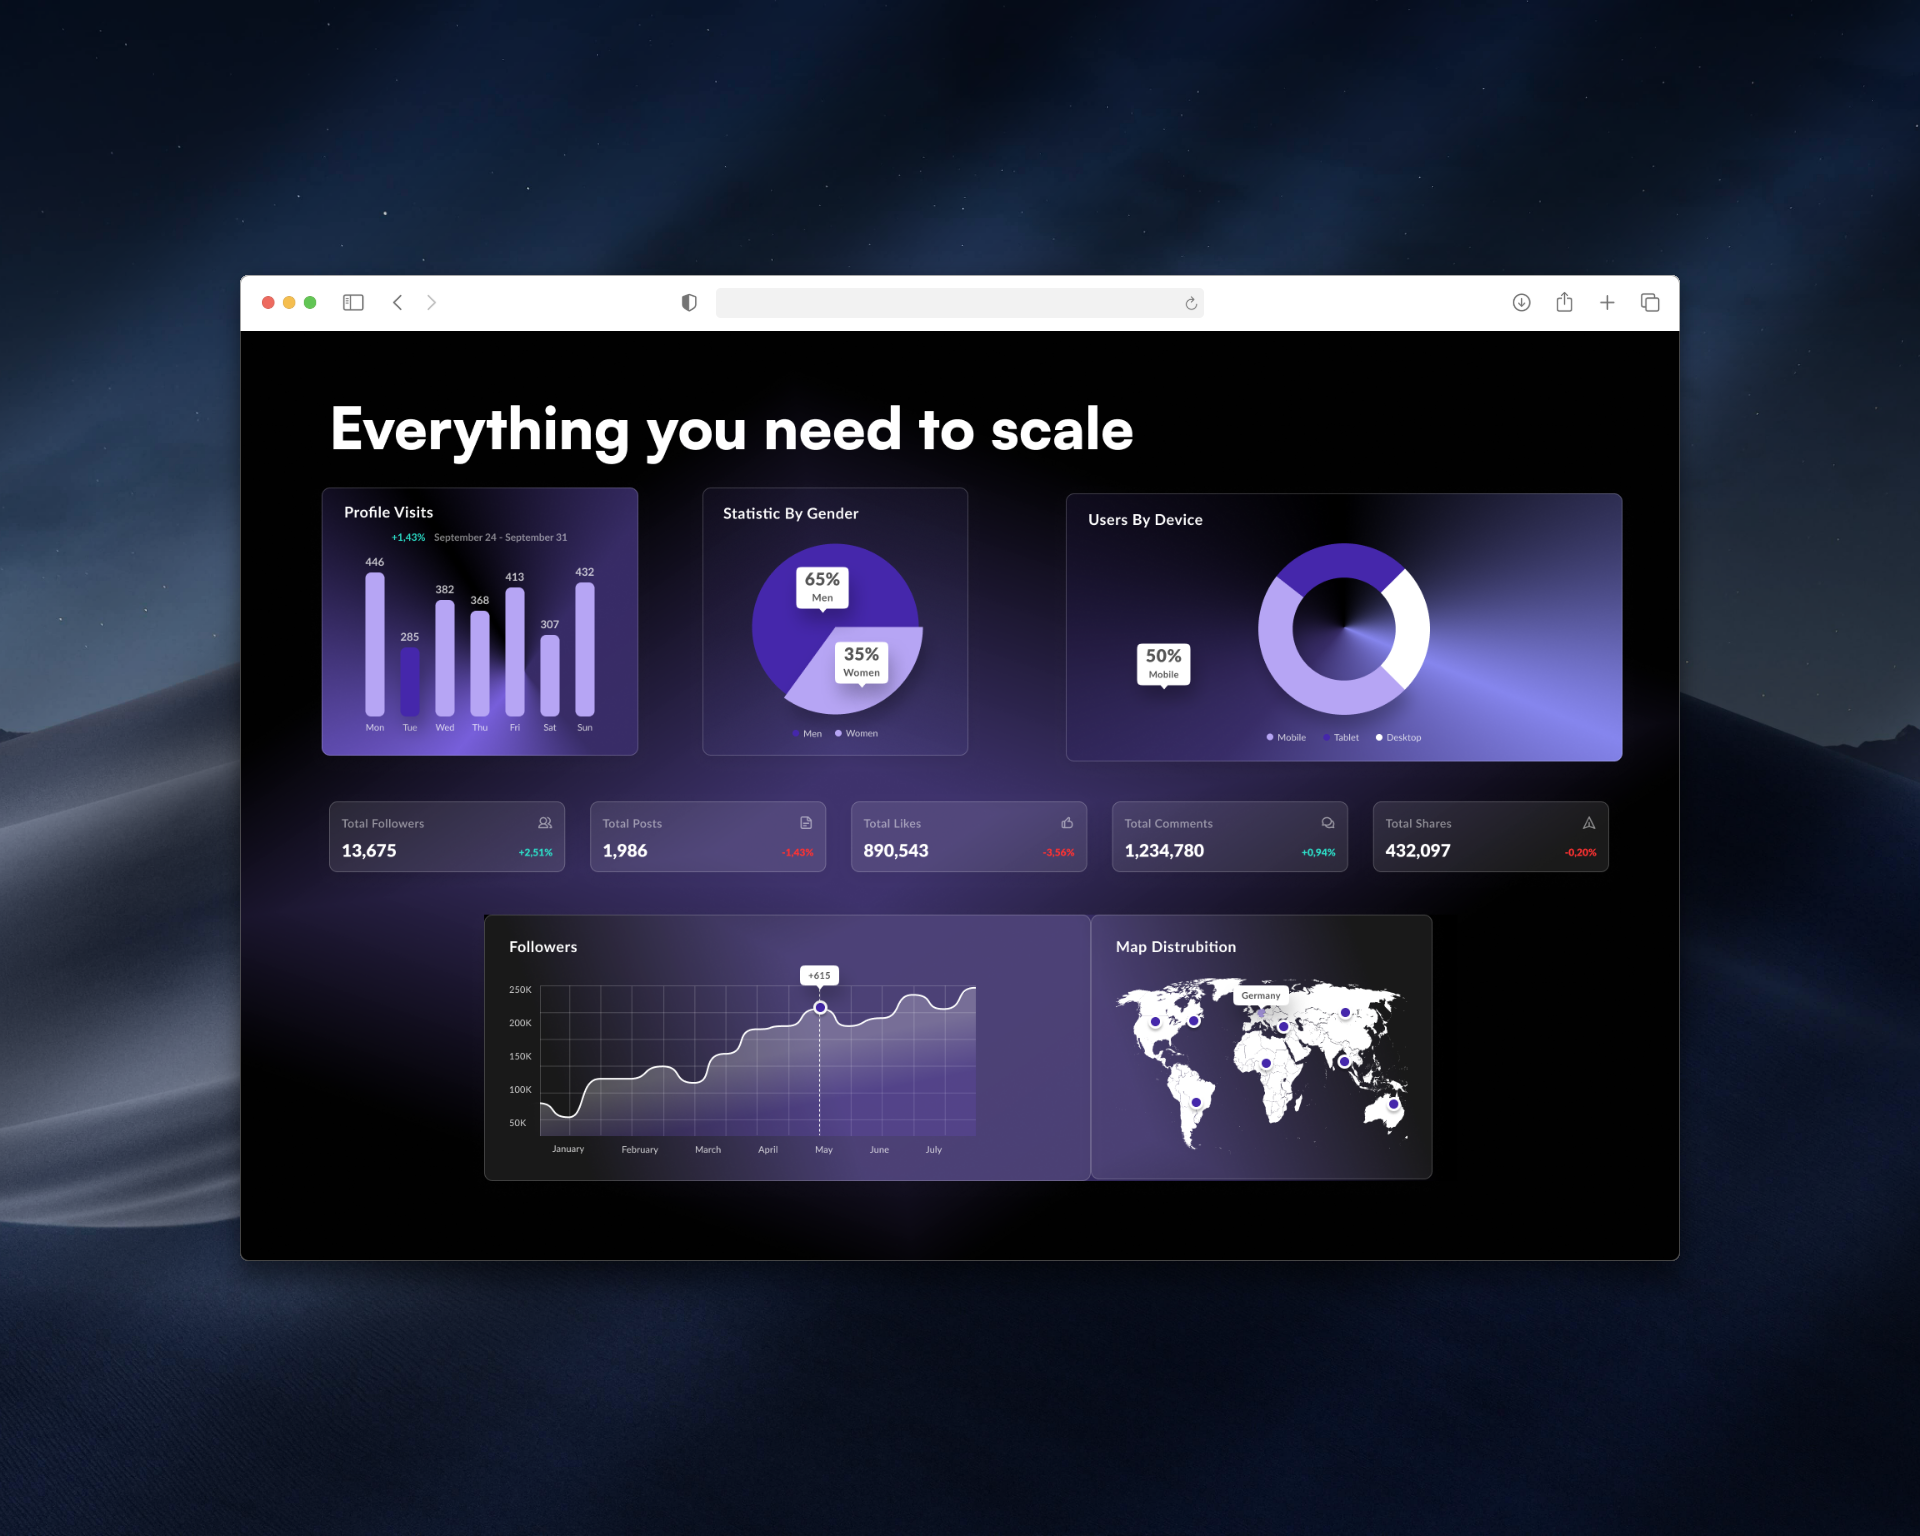
30+ screens, a token-driven theme, and a data-viz library tuned for both light and dark surfaces.
[ N° 04 // Process ]
Problem
to pixel.
Every project moves through the same spine — research, wireframes, mockups, ship — but the weight on each step changes with the brief.
- 01 · Research01 / 04
User interviews
Talked to 8 creators (50k–2M followers). Recurring pain: 'I open three tabs and still can't tell if last week was good.' Distilled findings into 3 jobs-to-be-done and a north-star metric: time-to-insight under 10 seconds.
- 02 · Wireframe02 / 04
Information architecture
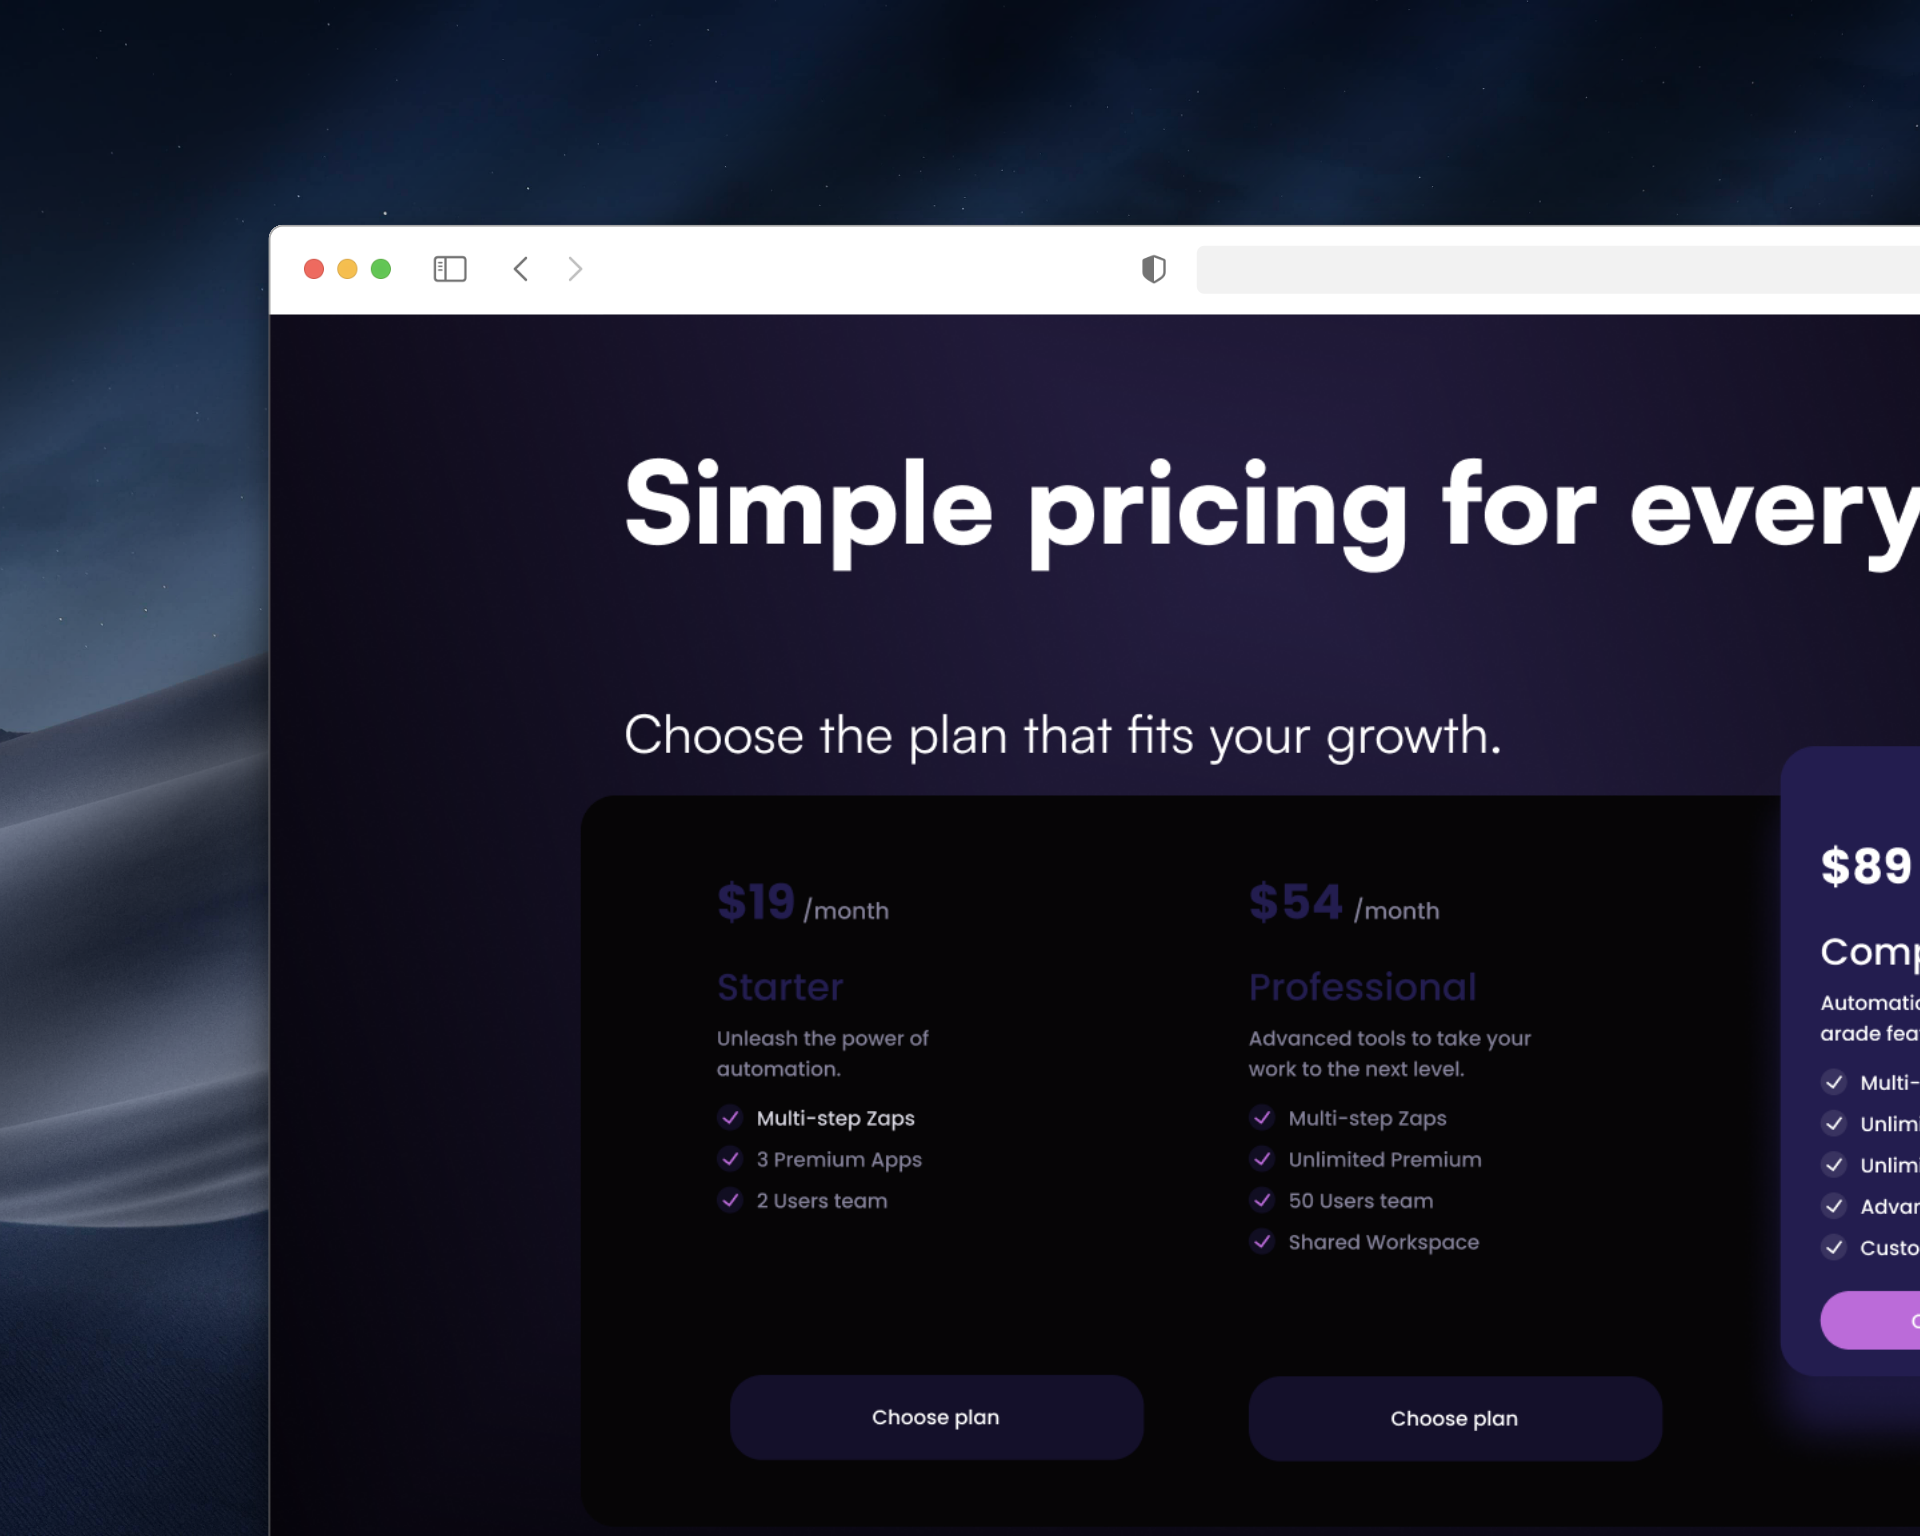
Sketched dashboard layouts on paper, then moved to Figma greyscale wires. Tested 4 IA models with a tree-test; the winner grouped by 'goal' (grow, monetize, compare) instead of by platform. Wireframed onboarding as a 3-step funnel.
- 03 · Mockup03 / 04
Component & data-viz system
Built 60+ components on a 4pt grid with semantic tokens for both themes. Designed a chart kit (line, area, sparkline, comparison) tuned for low-contrast data points. Pixel-pushed the empty, loading and error states for every key surface.
- 04 · Prototype04 / 04
Validation
Clickable Figma prototype tested with 5 creators. Cut two settings screens, rewrote 3 chart titles, and shortened onboarding from 6 to 4 steps based on hesitation points in the recordings.